
Current Affairs
Trump Claims U.S. Has ‘Best Poverty Numbers Ever’ in September 2026
The US poverty rate 2026 hit 10.2%, the lowest on record. But Trump’s September claim requires context about survey timing and methodology.

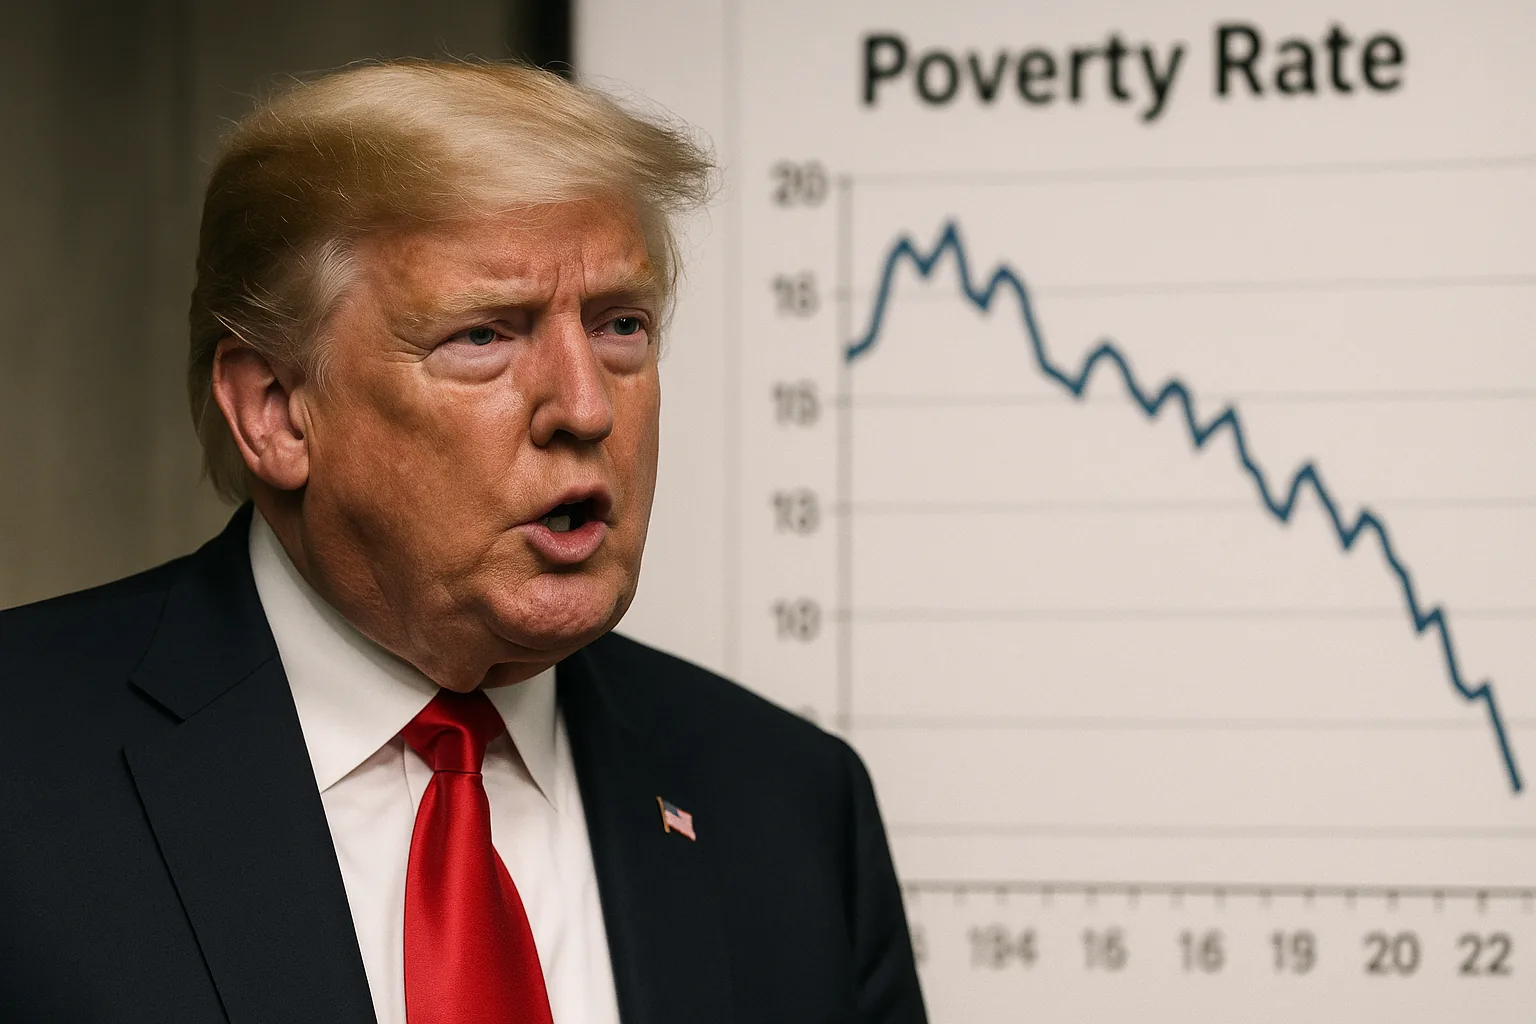
When President Donald Trump stepped outside the White House on Sunday, September 27, 2026, he told reporters something that immediately drew scrutiny from economists, journalists, and policy analysts: that the United States had achieved poverty numbers better than at any point in the nation’s recorded history. The claim landed squarely in the middle of an ongoing national debate about the us poverty rate 2026, economic inequality, and how official statistics should be interpreted — and whether a single headline figure can fairly summarize the lived experience of tens of millions of Americans. Understanding what the data actually shows, what it measures, and what it leaves out is essential before drawing any firm verdict.
Exactly What Trump Said and When He Said It
Trump’s precise words, delivered outside the White House on September 27, 2026, were: “We have the best poverty numbers ever in the history of our country. In other words, there’s less poverty now than at any time in the history of our country.” He repeated the claim the following Monday as well, amplifying its reach across broadcast and social media. The statement was made in the context of a Census Bureau report released in September 2026 — formally titled Poverty in the United States: 2025 — which provided the most recent official snapshot of poverty across the country.
The repetition of the claim on two consecutive days suggests this was not an offhand remark but a deliberate talking point tied directly to that Census Bureau release. The question facing fact-checkers and analysts was not whether Trump had made the statement — that is thoroughly documented — but whether the statement was accurate, and what context was necessary to evaluate it fairly.
What the Census Bureau’s September 2026 Report Actually Shows
The Census Bureau‘s Poverty in the United States: 2025 report, released in September 2026, recorded a national poverty rate of 10.2% for 2025. Multiple sources, including U.S. News & World Report, confirmed that this figure represents a historic low — the lowest official poverty rate recorded in U.S. history under the Census Bureau’s standard methodology.
That is a meaningful data point. A rate of 10.2% is genuinely lower than any previously published annual figure in the official series. In that narrow, technical sense, Trump’s core claim — that there is “less poverty now than at any time in the history of our country” — aligns with what the Census Bureau’s report shows. Snopes, one of the most widely cited independent fact-checking organizations, rated Trump’s claim as True on the basis of that same data.
But the headline figure is only the beginning of the analytical work. Several important contextual layers sit beneath that 10.2% number, and responsible interpretation of the us poverty rate 2026 discussion requires engaging with all of them.
The Critical Timing Problem: What the 2025 Data Does and Does Not Reflect
One of the most significant caveats attached to the Census Bureau’s 2025 poverty report is methodological: the data is drawn from surveys conducted in March 2025. That means the figures capture economic conditions as they existed roughly eighteen months before Trump made his claim outside the White House in late September 2026.
👉 Read also: False and Misleading Claims About US-Canada Relations Since Trump's 2024 Reelection
As the Orlando Sentinel reported in its fact-focus coverage published on September 29, 2026, the 2025 poverty rates are “a snapshot from March of that year and do not reflect the current economy.” This is not a minor technical footnote — it is a structural feature of how the Census Bureau collects and publishes poverty data. The Annual Social and Economic Supplement to the Current Population Survey, which underpins these figures, asks respondents about their income and poverty status in the prior calendar year. By the time the report is released, the data is already many months old.
When Trump stood outside the White House in September 2026 and declared the country had its best poverty numbers ever, he was citing data describing conditions from early 2025. A great deal can change in an economy over eighteen months. Interest rate environments, employment conditions, inflation trajectories, and policy changes can all shift the poverty landscape substantially. The Census Bureau report does not — and cannot — tell us what the poverty rate looks like in September 2026. That data simply does not yet exist in published form.
This distinction matters enormously for public understanding. Presenting March 2025 data as evidence of what is happening right now in the fall of 2026 conflates a historical snapshot with a current condition. The two are not the same thing, and treating them as equivalent can lead to a distorted picture of where the country actually stands today.
How the 10.2% Figure Fits Into the Longer Historical Record
To evaluate Trump’s superlative — “the best poverty numbers ever in the history of our country” — it is necessary to understand how the official poverty rate has moved over the decades since the Census Bureau began publishing consistent data. The official poverty measure was introduced in the 1960s, meaning the historical series covers roughly six decades of annual data.
Over that period, poverty rates have fluctuated considerably in response to economic cycles, policy changes, demographic shifts, and measurement adjustments. Rates were relatively high in the early years of the series, declined sharply through the late 1960s as Great Society programs expanded, rose again during the recessions of the 1970s and early 1980s, and have oscillated since then in rough correlation with the broader business cycle. The Supplemental Poverty Measure, introduced by the Census Bureau in 2011 to capture a broader range of resources and expenses, tells a somewhat different story than the official measure and is not directly comparable across the full historical series.
Within the official measure’s consistent methodology, the 2025 figure of 10.2% does appear to represent the lowest recorded annual rate. That is the factual basis for the claim. What the historical record also shows, however, is that poverty rates are sensitive to the specific year being measured, the methodology applied, and the economic conditions prevailing at the time of measurement. A rate that is historically low in one methodological framework may not be the lowest possible under an alternative measure — and vice versa.
The us poverty rate 2026 conversation is further complicated by the fact that the official measure has long been criticized by researchers across the political spectrum for failing to account for non-cash benefits such as food assistance, housing subsidies, and tax credits. When these are included, as in the Supplemental Poverty Measure, the picture of who is poor and by how much shifts meaningfully. Neither measure is universally agreed upon as the definitive standard.
👉 Read also: US Vote Against UN Women's Equality Resolution: Fact-Check After Trump Withdrew from UN Women
What Sources Emphasize Beyond the Headline Rate
Multiple outlets covering Trump’s September 2026 claim took care to note that even a historically low poverty rate does not mean poverty has been eliminated or that economic hardship is no longer widespread. A rate of 10.2% applied to the U.S. population still represents a very large number of people living below the official poverty threshold. The U.S. News & World Report fact-focus piece published on September 29, 2026 specifically noted that “other factors” deserve consideration alongside the headline figure — a framing that signals the data is real but requires context to be properly understood.
Those other factors include the geographic distribution of poverty, which remains highly uneven across states, counties, and urban versus rural areas. They include the depth of poverty — how far below the poverty line people fall, not just whether they cross it. They include child poverty rates, which can diverge significantly from the overall rate depending on policy environments and family structures. And they include the question of whether the conditions that produced a 10.2% rate in March 2025 have persisted, improved, or deteriorated in the eighteen months since that snapshot was taken.
None of these considerations contradict the basic finding that the 2025 poverty rate was historically low. But they do complicate any claim that the poverty story is simply and straightforwardly the best it has ever been. Policy analysts and economists have consistently argued that a single annual percentage point, while useful, is an incomplete instrument for measuring the full texture of economic hardship in a country as large and diverse as the United States.
Assessing the Claim: True, but Incomplete
Based on the verified evidence, Trump’s claim that the U.S. has “the best poverty numbers ever in the history of our country” is supported by the Census Bureau‘s own data, which shows the 2025 poverty rate of 10.2% is a historic low in the official series. Snopes rated the claim True on exactly this basis. The statement is not fabricated, and it is not contradicted by the primary source data available.
At the same time, the claim carries significant contextual weight that Trump did not acknowledge. The data is from March 2025, not from September 2026 when he made the statement. The us poverty rate 2026 — meaning the rate as it stands in the fall of 2026 — is not yet known from any published official source. Presenting an eighteen-month-old snapshot as a description of current conditions is a meaningful omission. Additionally, the official poverty measure has well-documented limitations that researchers across the ideological spectrum have long noted.
The responsible interpretation of the available evidence is therefore layered: the underlying data point is real and the historic-low characterization is accurate within the official methodology, but the framing of that data as a live description of the current moment goes beyond what the evidence supports. Readers engaging with the us poverty rate 2026 debate should understand both what the Census Bureau’s report confirms and what it cannot tell us about conditions today. A historically low poverty rate from a March 2025 survey is a genuine achievement worth examining — and it is also a figure that requires honest context to mean what public figures imply when they cite it.
The broader lesson from this episode is one that recurs whenever official statistics enter political debate: the number itself is only as useful as the methodological understanding surrounding it. A poverty rate of 10.2%, described accurately and in full context, tells an important story about where the United States stood in early 2025. What it cannot do, by design, is tell us where the country stands right now — and that gap between what data shows and what claims assert is precisely where careful scrutiny remains most valuable.
This article was produced with AI assistance and reviewed editorially.

Trump Claims U.S. Has ‘Best Poverty Numbers Ever’ in September 2026

Satire Article About Kamala Harris’s Campaign Debt Spread as Fact on Social Media in 2026

AI-Generated Video of Pro-Palestine UK Rally Spreads with SynthID Watermark Visible

Alleged October 1, 2026 Trucker Strike: No Evidence Found
